Your organization’s resonant frequency

Source: https://commons.wikimedia.org/wiki/File:Wave_Sinusoidal_Cosine_wave_sine_Blue.svg
This file is licensed under the Creative Commons Attribution-Share Alike 3.0 Unported license.

What’s new?

As reported in MMS Online on 2 October 2020, in partnership with Oak Ridge National Laboratory, MSC Industrial Supply Co technicians have been trained to use a so-called tap test to determine the optimal speed at which a CNC mailing machine or machining center can be operated. It is hoped that widespread use of this technique will enable these machines to operate at higher speeds, thus increasing the capacity of the estimated 30,000 machine shops in the US.

What does it mean?

Vibration, oscillations, and repeated motion are fundamental concepts in engineering because they describe so many physical phenomena. A struck bell emits a tone because the strike causes the bell to vibrate at a particular frequency and the vibration of the bell causes the air to move at that same frequency, generating the sound that a human hears. A person on a swing goes back and forth at the natural frequency of that pendulum and the amplitude of the motion is increased if the person is pushed at the appropriate time in the swing. I live 10 miles down a dirt road and sometimes a portion of the road will develop a washboard; driving over that portion at different speeds may reinforce or dampen the up-and-down motion of the car.

In 1831, marching soldiers inadvertently marched at the natural frequency of a suspension bridge, which collapsed under them; hence, the command for soldiers to break step when crossing a bridge. For decades, engineering students have been shown a video of the 1940 destruction of the Tacoma Narrows Bridge by oscillations reinforced by wind. The point is to vividly demonstrate to engineering students the importance of considering vibrations.

Picture a rotating tool with several cutting blades.  The tool will be vibrating at its natural frequency. If the tool has moved away from the surface being cut, then the blade takes a shallow cut; if the tool has then moved back toward the surface for the next cut, then the blade takes a deep cut, resulting in reduction in surface smoothness in the machined part. If the vibration and rotation of the tool are appropriately matched, each blade will take the same amount of cut, resulting in a smooth surface. The second video (called MSC MillMax) at this web page illustrates this effect and explains that the tap test is used to determine the natural resonant frequency of the machining center using that tool.

The instinctual response to a mismatch (detected as chatter) is to slow down the rotation of the tool, but that response may not be correct. In the tap test, a small accelerometer is attached to the tool, and it records the vibrations when the tool is tapped. These data are analyzed by software which predicts which speeds are going to be stable in operating the machining center with that tool. With a tap test, the correct rotational speed to eliminate chatter can be determined, often resulting in the ability of the machining center to operate at a higher rate.

What does it mean for you?

First, machines always have vibration issues. These issues may impede production, may lessen the useful life of the machine, and may harm workers. Vibrations from jackhammers are a notorious hazard to humans, but other vibrations also have ergonomic concerns.  It is always worth asking about vibration issues.

Second, when seeking the best settings for a machine, one must be careful not to settle for a local optimum (the best combination of settings compared to small perturbations in settings) rather than obtaining the global optimum (the best combination of settings among all possible combinations). Incremental improvements (for example, making small adjustments in settings until no further improvement occurs) may miss a better solution. This idea may apply in any design situation. Sometimes you need to change everything, not just make small changes, or you will miss opportunities for improvement. Don’t get stuck in a local optimum.

Finally, the article discusses why each machining center must be tested and tuned. Tom Smith, one of the inventors of this process, says, according to the MMS Online article:

“The reality is that most shops are under-using their equipment because they don’t know what their equipment can do. And the reason that they don’t know what their equipment can do is that the performance depends on the whole system that gets put together. It’s the machine tool, and then the tool holder and then the tool. It’s the fixturing. And it’s not until you assemble them all together that you get the system whose performance you’re interested in, right? So, the spindle maker makes the spindle, the machine tool maker makes the machine, and the tool maker makes the tool. And they all sell it to you separately with no idea how you’re going to put it all together. They can’t tell you how to use it. But then when something goes wrong, there’s a big tangled mess. You call the tool maker and they say, ‘Oh no, everybody loves our tools! They worked fine in other places so there must be something wrong with your older machine.’ And you call the holder maker and you call the machine maker and they all say, ‘Everybody loves our stuff!’ And you’re still stuck.” (emphasis added)

Maybe someday someone will invent a tap test for determining the resonant frequency for an organization, but, until then, nobody can tell you exactly how to optimize the system that you have, since every system has unique combination of components that make up a unique system.

Where can you learn more?

The software for the tap test was developed by MLI, Manufacturing Laboratories Inc. The MSC Millmax program is described at this web page.

The MMS Online article places the tap test and its promise for increasing the capacity of machine shops within the larger context of bringing manufacturing back to the US in order to secure supply chains against a future disruption such as the one that has been caused by COVID19.

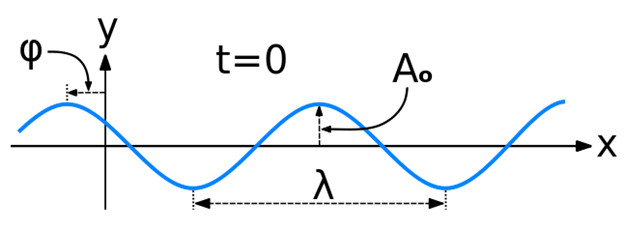
Postscript: My EJB Partners colleague Elliott Ring sent me a link to this video, which shows how metronomes become synchronized; Dr Ring uses this video to talk to groups of people about how teams evolve. Note that this demonstration works because of several important properties of this system: (1) the metronomes have the same frequency (or wavelength); they are out of phase at the beginning and become in phase (wavelength is given by the distance labeled with the Greek letter lambda in the picture at the top of this post; phase is indicated by the time of the trough of the wave); (2) the synchronization occurs not when they are on the table, but only after they are placed on the soda cans; and (3) the metronomes are mechanical devices, not, for example, software generated click tracks. The metronomes synchronize when they are able to exchange mechanical energy with each other (becoming coupled in one system, instead of being separate), through the flexible board, providing nudges to each other. Similarly, one can change the phase of person in a swing by pushing them at a slightly different phase; eventually the swing will adjust.

This work is licensed under a Creative Commons Attribution 4.0 International License.

High class grifters

r/family_history - High class grifters in my tree. Litigious high class grifters.

Genealogy is my hobby and since I am now retired I am spending HOURS tracing my ancestors. I have been working on getting more information on my 5x great grandparents Samuel STEVENSON and Cecilia MILLAR from Scotland. They were, I think, high class grifters. He was a merchant and a Burgess in both Glasgow (1726) and Edinburgh (1742), which is very establishment – being a Burgess was a big deal.

So what did he sell? He made an excellent living selling Anderson’s pills, which seem to be quack medicine. A Dr Anderson developed them in the 17th century from a secret recipe from Venice. How did my Samuel get the recipe? Cecilia, before she married Samuel, worked for the family that made Anderson’s pills and it seems she stole the recipe; she was actually fined and imprisoned for selling the pills in Edinburgh.

Samuel and Cecilia married in Edinburgh about 1722, had 3 children there, then moved to Glasgow, where Cecilia died in 1728. That same year Samuel started marketing the pills. By 1736 he moved back to Edinburgh and in a 1739 ad actually bragged about Cecilia stealing the recipe: “… Tho. Weir only communicated the Secret to his Spouse, who out-lived him; and Mrs. Weir was assisted in making up the said Pills, for several Years, by my deceas’d Spouse, who revealed the Secret to none but myself, after Mrs. Weir’s Death. …”

Samuel traded insulting ads with Mrs Weir; at one point he likened her to a snake. At some point he lost a lawsuit brought by her (I am still trying to get those details). But he made enough money that he left a complicated will with money going regularly to his 5 grandchildren, who ended up suing each other after his death. That lawsuit dragged on for years. It came out in the lawsuit that one of the grandchildren (another Samuel STEVENSON, a surgeon and my ancestor) was not considered fit to administer the affairs of his not-quite-right sister Cecilia, so the cousins had to do it. That Samuel was known to be bad with money apparently.

One of the other grandchildren, Samuel Stevenson GRAHAM, became the Lt-Governor of Stirling Castle (a big deal) and is buried there. His biographer claimed that Cecilia (his grandmother) was related to some posh MILLARs, but I am beginning to suspect she lied because I cannot find that connection (and that MILLAR family is filled with ministers who I cannot believe would associate with my people). An early member of the other MILLAR family was actually the wife of John KNOX. I am not making this up.

Then there is the lawsuit by Ann McILWRAITH against her husband, Samuel’s son Alexander STEVENSON (another surgeon), to declare that the couple actually was married (although there doesn’t seem to be any record). They must have reconciled since they had 5 children (including my ancestor the second Samuel STEVENSON) after that lawsuit. Ann’s father was Andrew McILWRAITH a semi well known portrait artist and a Burgess in Edinburgh in 1735. And Andrew’s wife was Ann MOSMAN, the sister of William MOSMAN, another portrait artist, who some say was of Jewish descent.

There seem to be other lawsuits about various properties owned or in the possession of Samuel and his son Alexander STEVENSON; I am trying to figure all of those out.

I think I have enough material for a TV show. But who would believe it? I hope you find it all as amusing as I do. I just wish my father (who was born in Glasgow) were still alive because he would think this was all really entertaining.

Your organization’s thermostat

What’s new?

Modern Machine Shop Online reported on 18 September that Rigibore’s ActiveEdge wireless boring bars (working in conjunction with sensors) automatically adjust the boring system to reliably produce holes within the desired tolerances for the hole diameter. The automatic nature of this system eliminates any errors due to human adjustments.

What does it mean?

Many parts require a hole to be drilled; the hole must be within a specified tolerance range, that is, the diameter must be greater than a specified lower limit and must be less than a specified upper limit. Reliably drilling holes within the tolerance is necessary for the part to function properly. With an in-process measurement system, each hole is immediately and automatically measured. The measurement is recorded and, if it is out of specified warning levels (that are within the tolerance range) the drilling system is adjusted. The warning levels mean that the most recently produced part is still within tolerance (and the part does not need to be rejected), but the part is nearing the upper or lower tolerance limit.  With the Rigibore system, that adjustment is done automatically; the measurement is sent wirelessly to the cutting system, which automatically makes the correction.

This system of measurement and adjustment is a negative feedback system. If the diameter is too large, the cutting diameter is made smaller for the next part; if the diameter is too small, the cutting diameter is made larger. A thermostat is the same type of system: if the room is too warm, the temperature is reduced by cooling; if the room is too cold, the temperature is increased by heating. You do the same when you drive: if your car is drifting right, you make an adjustment in the steering to head to the left; if your car is drifting left, you make an adjust to head to the right. This feedback is called negative feedback because the system is adjusted in the opposite direction of the detected measurement. A negative feedback system, if well designed, keeps a goal within specified limits.

The article reminds us that accurate measurement is necessary. The article quotes Rigibore’s president as saying “Gage accuracy has to be rock solid.” If your measurement says the room is too hot, but it actually isn’t, the correction made to cool the room may actually cause it to become too cold.

The article reminds us that randomness can occur; as mentioned in the article, a measurement might be inaccurate due to a piece of dirt in the hole. The Rigibore system makes an adjustment only after detecting two measurements outside the warning limits. Feedback systems, if poorly designed, can chase random effects, creating more rather than less variation. Dr Deming’s funnel experiment was designed to illustrate the ill effects of tampering with a system.

The article reminds us that the timing and the amount of adjustment have to be selected carefully. Rigibore has designed the system to make adjustments without increasing the time it takes to bore a hole. The system is also designed to make very small corrections. Overcorrection in driving is well known to lead to accidents.

While the article doesn’t remind us, feedback systems work only if the system being controlled is well understood. The goal must be clearly stated (a hole with diameter within tolerances), the measurement to be made must be clearly defined (the diameter), the measurement system must be accurate (“Gage accuracy has to be rock solid.”), and the action to be taken to correct the system must be well understood (if the diameter is too large, reduce the size of the bore by a small amount).

Negative feedback control is a simple model but its concepts underlie much of engineering. Control charts, one of my areas of expertise, are based on the same concept of monitoring a key performance variable and taking corrective action when measurement indicates the system has deviated from ideal settings. Control charts add the interesting concept of also monitoring and controlling the variation in that key variable.  Reducing variation is a valuable strategy for keeping the variable within limits.

What does it mean for you?

The most important part of negative feedback control is that it is closed control, that is, the system itself is measured before a decision is made on what control to implement. That simple concept may need reinforcing with some who think they can steer without first finding out where they are currently heading.

If an the organization identifies a goal to be kept within certain limits (for example, growth rate in sales, the number of product design changes being implemented, or the amount of emails and other communication being sent in the organization), the organization’s leader can ask for a clear statement of the goal, a clear definition of the measurement, an accurate measurement system, and – the most difficult part – a clear description of the system for controlling the goal. What are the factors that can be used to heat up the room (increase sales) or to cool the room (decrease sales)? What is the time scale on which each of these factors operate? What are the levers that the organization can use to affect those factors? No organization can probably answer all those questions, but the discipline of asking them focuses discussion and research.

The need to have that clear understanding supports the idea that the role of leadership is to study and understand the system that is their organization and the system within which the organization works. Workers work in the system; management works on the system.

The metaphor of control in this simple model may lead some to think that the lesson is top-down management, but the Rigibore system is so successful because the measurement and corrective action have been delegated to the lowest level of control, the actual tool. The people and sensors closest to a key variable must have the authority to measure and control that variable.

Finally, this MMS Online article on Rigibore highlights the importance of definition and measurement. You cannot control what you can’t define and measure. See this explanation from the US Bureau of Labor Statistics on the definition of the unemployed and the employed and, while they are correct to state that the basic concepts are simple, the details are devilish. The BLS itself reports the values of several measurements not just of unemployment but also of underemployment.

Where can you learn more?

The mathematics of negative feedback control is simple and elegant, but also leads to more complicated models. See, for example, this explanation from chemical engineering. Then there is the textbook used for the course in control systems at my former university (Colorado State University-Pueblo), Feedback Control Systems by Charles L Phillips and John Parr, now in its 5th edition.

Feedback control goes by other names. Deming describes balancing loops. Senge’s fifth discipline is systems thinking and his first systems archetype is balancing feedback.

Metaphors are powerful. Contemplating their use can lead one down numerous deep rabbit holes. The Stanford Encyclopedia of Philosophy says: metaphor “has attracted more philosophical interest and provoked more philosophical controversy than any of the other traditionally recognized figures of speech.” Gareth Morgan is the best known proponent of the use of metaphors to understand management, as described in his book Images of Organization, first published in 1986 and revised in 2006.

This work is licensed under a Creative Commons Attribution 4.0 International License.

A picture is worth a thousand words

White clinker after kiln exit.
Source: https://commons.wikimedia.org/wiki/File:Hot_Clinker_2.jpg
This photograph is in the public domain.

What’s new?

Thyssenkrupp is a large German construction company that specializes in designing and building production facilities for the chemical, cement, and mining industries. As described in this recent article on their website, thyssenkrupp engineers in Germany recently completed remotely the commissioning of a clinker production line in Guatemala; also thyssenkrupp engineers in India and Germany remotely performed a performance test on a plant in Kenya. Usually these tasks would be done on site, but COVID19 concerns led to remote completion instead.

What does it mean?

A contract to build a large production facility often includes, as one of the final steps, a demonstration that the facility works according to all the requirements in the contract; this step is called commissioning the plant. In addition, the contract may include a bonus payment if the facility can demonstrate its ability to meet a goal substantially beyond the minimum production rate specified in the contract; this step is called a performance test.

The production of Portland cement involves crushing rock of a certain composition, combining it with other material, heating the resulting mix to drive off undesirable gases, thus producing marble size material called clinker. Clinker is ground and mixed with other ingredients to form the final product, cement powder. Some plants may stop at the production of clinker, which can be shipped to locations near where cement is needed and ground into cement there. Shipping clinkers instead of the finished cement avoids “the difficulties of carrying cement powder.”

COVID19 has curtailed travel drastically and made many meetings move from face-to-face to online. People have had to adapt business practices in many ways. Some speculate that business travel may permanently decline, as methods are refined for better remote communication. What does it take to remotely commission or test the performance of such a complicated plant?

In full disclosure, I love Zoom. Being able to attend (and host) meetings with people from all over Pueblo (and further) without having to drive to town (and leave my wonderful home on 53 acres 10 miles down a dirt road) is fantastic. I meet twice a week online with my colleagues Elliott and Bill from EJB Partners; I can’t remember the last time we met in person (probably in March).  But doing well at online meetings requires the right tools. As someone who wears hearing aids, clear sound at sufficient volume is important; I am still experimenting with speakers and microphones and I haven’t found the right headphones that work well for me. Many of us have learned to share screen and to use the chat box for public and private discussion to support the auditory channel during the meeting.

In this case, the thyssenkrupp engineers had to be able to observe and control the operation of the plant in some detail. In the first example, “A virtual control center was set up in Neubeckum, where thyssenkrupp’s commissioning engineers had the same picture in front of them as the customer’s operating personnel in Guatemala.” And similarly in the second case, “In virtual control rooms in Neubeckum, Germany, and Pune, India, the control panel of the plant in Kenya was projected onto huge screens.”

I have reproduced below a portion of the picture at the top of the thyssenkrupp news story.

Source: https://insights.thyssenkrupp-industrial-solutions.com/story/cement-production-remote-performance-testing-and-commissioning-a-successful-first/

While not clear (and perhaps deliberately blurred by the company), the screen on the left can be seen to show a systems diagram for the plant, showing the flow of material and probably also displaying real time values of certain settings controlling the plant (for example, the status of valves) and real time values from certain sensors (for example, temperatures at different points). This systems diagram presents an overview and is probably be supported by more detailed views of portions of the overall system.

What does it mean for you?

A clinker production facility is a complicated device. The picture above represents the shared understanding of how the plant works, including how the material flows and how the parts interact with each other. This understanding reflects the knowledge of engineers and enables them to understand what is happening as well as share that understanding with each other. It is hard to overestimate the importance of this diagram in the ability of the thyssenkrupp engineers to communicate with those in the room with them as well as with those thousands of miles away. The icons, the colors, the lines, etc., all have specific meanings that all the engineers know immediately. Since the team involved in the performance test certainly included native speakers of at least German and Spanish, this diagram is written in a shared language that all understand.

What is the shared diagram for your organization? Creating such a diagram is hard work, even for a physical system such as a production facility; the creation of such a diagram is even harder for a system involving more than physical flows. At its simplest, the system diagram should show how objects (physical or conceptual) move through your organization, but you should also seek to understand and represent how your organization is placed within a larger system.

Creating that diagram will require making explicit knowledge that is already shared by the members of your organization, but it will probably also require unearthing implicit knowledge and reconciling the conflicting views of people in your organization. While chemical plants, circuit diagrams, and medical family trees, for example, already have standard icons and rules and you may be able to borrow some ideas from such sources, you will probably need to develop your shared language of symbols. You may find that no one in your organization understands some parts of your system, and you need to do some research or experiments to achieve that understanding. My first professional job (while I was in graduate school) was for the corporate planning officer at a major medical organization; I did many studies for him in order to support the organization’s understanding of its various systems. The goal is not just to support remote work, but to support more productive work in all forms.

Where can you learn more?

This free course on systems diagramming from the Open University is a great starting place for understanding the purpose of and techniques for systems diagrams. Tools that are useful for creating systems diagrams include process maps, mind maps, force field diagrams, and many more.

Companies offer tools to help you such, as the Business Model Canvas. The Object Management Groups has created a standard for Business Process Model and Notation.

This work is licensed under a Creative Commons Attribution 4.0 International License.

Draw me a picture

Source: author

What’s new?

In an article published 2 October 2020 on the website of NIST (the US National Institute of Standards and Technology), KC Morris (leader of the Information Modeling and Testing Group in the Systems Integration Division of NIST) describes the new ASTM standard E3012-20, “Standard Guide for Characterizing Environmental Aspects of Manufacturing Processes.” This standard describes and builds on a Unit Manufacturing Process (UMP), which is shown in the following figure.

Source: https://www.astm.org/Standards/E3012.htm

What does it mean?

The simplest model of any manufacturing process involves identifying the inputs, the process, and the outputs, as shown at the top of this post.

Thus, when I make my breakfast, I use inputs (soy milk, yogurt, CBD oil, hemp protein powder, and frozen fruit), which I blend in a food processor to create the output, my breakfast smoothie.

There is a long history of modeling manufacturing process in such a way, with more details. My first faculty office at Purdue University was next door to the office of Alan Pritsker, one of the founders of the field of computer simulation, and from him I learned about the development of IDEF, Integrated DEFinition Methods in the 1970s, which in turn had been developed from SADT  (Structured Analysis and Design Technique). Much of the work happened in the Air Force program ICAM (Integrated Computer Aided Manufacturing, which aimed to create standard data models. The basic element of IDEF0 (IDEF zero) is shown in this diagram:

Source: author

This diagram is the same as the simple Inputs-Process-Outputs diagram with the addition of Controls, which are the inputs that are used to direct the process, and Mechanisms, which are the inputs in the form of the resources and tools used to do the process. In my breakfast example, this expanded diagram allows the explicit identification of the recipe as the Control and the food processor as the Mechanism.

Obviously, in a manufacturing system the output from one process is input to the next process. IDEF0 blocks can be joined, resulting in a diagram such as this one showing the flow of physical objects and information:

Source: https://commons.wikimedia.org/wiki/File:IDEF_Diagram_Example.jpg.
This diagram is in the public domain.

These diagrams and concepts support thinking about processes and systems in manufacturing, resulting in systematic thinking (each process is documented and diagrammed in a similar way) and also systemic thinking (the relationship among processes is documented and can be studied).

The newly proposed UMP is obviously a new version (or reinvention) of SADT and IDEF – and probably of some other similar diagrams that I am not familiar with. An expanded version of the UMP is shown below:

As compared to IDEF0, Transformation is another word for Process, Product and Process Information plays the role of Controls, and Resources the role of Mechanism. The difference from IDEF0 is that the emphasis in this new standard is on being able to describe and measure the environmental aspects of a manufacturing process. The standards are meant to help manufacturers better understand these environmental impacts and thus  make better decisions about trade-offs among goals such as minimizing the use of resources and maximizing the speed of manufacturing.

What does it mean for you?

Systems thinking is a good thing. The simple step of drawing a line around a set of tasks and calling them a process seems trivial but it focuses one’s thinking on those tasks, it highlights the flow of material and information to support those tasks, and it supports the connection of those tasks to the previous and following tasks. With such thinking, a process then is a system, and it is part of a larger system.

Diagrams are good things. I always told my graduate students that we were well on our way with their work when we had a diagram that captured the basic ideas. As I have shown, the new UMP is not new, but the UMP diagram with arrows and labels is compelling: the concepts work, the words capture the ideas, and the lists associated with the major concepts make sure that the correct details are considered.

Finally, it really doesn’t matter which version of Inputs-Process-Outputs your organization uses. Pick a diagram, pick some words – even develop your own. Agree to use the diagram and the words throughout your organization and then get started on diagramming all the processes and systems. You will learn a lot about how your organization actually works if you make sure the results capture what is really happening and not just what is supposed to happen. You will certainly find that with some processes people don’t even agree on what is happening. A gemba walk (“gemba” is a Japanese word meaning, I am told, “the actual place”) will help; go and look at what is actually happening.

Where can you learn more?

Another example of the application of IDEF to furniture manufacturing is here. Dr Pritsker’s application of the IDEF methodology to modeling is described here.

Background on the issues that led to the development of the new ASTM standard are described in this 2016 paper.

ASTM, founded in 1898, used to stand for the American Society for Testing and Materials. Its name is now ASTM International.

There is so much available on process mapping that I hesitate to cite one or a few recommendations, but the ASQ (American Society for Quality) website is always a great starting place. Here is a good introduction from Netmind.

I’ll have a lot more to say about systems thinking in future posts.

This work is licensed under a Creative Commons Attribution 4.0 International License.

Charge me up

What’s new?

Bloomberg Quint reported two weeks ago that six Tesla batteries are now providing backup power to meet peak demand for electricity in a project in southwest England.   

What does it mean?

“[D]esigned for utilities and large-scale commercial customers,” a Tesla Megapack battery is an integrated package of storage of up to 3 MWh of energy with all the controls, cooling system, and inverters needed to connect the storage to an electrical system. Their modular design means they can be connected to each other to create large storage capacity. “1 Gigawatt hour (GWh) project provides record energy capacity—enough to power every home in San Francisco for 6 hours.”

Electricity must be provided instantaneously as users turn devices on and off, requiring electricity generation that can ramp up and down quickly. Stand by power for meeting peak demand is often the most expensive part of an electrical system because it is used so rarely but has to be present to guarantee meeting demand during the peaks. Typically peaker plants burn natural gas to generate electricity.

The sun doesn’t always shine, the wind doesn’t always blow, and the water doesn’t always flow, so renewable energy sources are at a disadvantage compared to using fuels to generate power, but energy storage technologies (such as batteries, pumped water, stored heat, etc.) are increasingly enabling the world to move electricity generation toward 100% renewable while maintaining reliability. By replacing electricity generated by fuel with electricity generated by renewable energy in base power (the generating plants that run all the time) and by using electricity storage for to generate peak power, a system can take advantage of renewable energy when it is available and still make sure the lights come on when the light is turned on. Charge the battery when the sun shines, the wind blows, and the water flows, then discharge it as needed.

Other changes in technology can support a system designed for 100% renewable including demand side management (utility company strategies that reduce the peak demand of users), integration of electrical grids (strategies to ship power from places with more than is needed to places experiencing shortages), and energy efficiency (strategies to reduce base power demand because the cheapest energy is still the energy saved). Improvements in manufacturing have already contributed to the decline in the costs of solar panels and wind turbines, and such improvements will also contribute to a continued decline in the price of battery storage.

Many large and small changes are contributing to these developments. For example, people are looking at how the batteries in electric vehicles can be used as storage devices not just to power transportation but also to feed back into the system at times of peak demand.

It’s all about the probabilities. Electric utilities measure reliability by SAIDI (system average interruption duration index), the total duration of interruptions as experienced by the average customer. The ideal is zero, of course, but some interruptions are inevitable during events such as hurricanes or earthquakes. Schools that have moved on line have speculated that snow days are in the past, but in my part of rural Colorado, the teacher and students may no longer need to get to the school in the snow, but they still need the electricity to be on so they can be online.

It’s not just the power, however, it’s also the frequency and voltage. I have oversimplified a bit by focusing on the provision just of the peak and base power; the electricity system must generate power  with stability in the parameters that matter in the use of the electricity.

What does it mean for you?

When you flip the switch on a light in your home or turn on a computer or a machine in your manufacturing facility, you want the device to come on and stay on. Because of developments like the Tesla battery, the future is bright – and reliable.

You and I can help move toward that future. Next week I am having my shingle roof replaced with a metal roof.  Then I will look at replacing the propane fueled heat in my house with an electric heat pump. Solutions that may have made sense 20 years ago when I had the house built need reexamination now. And I expect our upcoming purchase of a new refrigerator to reduce our energy consumption since consumer appliances continue to improve on this measure.

Where can you learn more?

Consultants abound to help you reduce your energy use in your business, but the place to start may be your electricity provider. They often have programs and incentives. Your next stop should be your state and local governments which may have substantial programs to reduce energy use.  Also, see this directory. Homeowners may be aware of the Energy Star ratings for home appliances; the program is also supports reduction of energy use in industrial companies.

Learning the language of energy consultants can help you find the right partner.  NIST (the US National Institute of Standards and Technology) has 51 Manufacturing Extension Partnerships (one in every state and Puerto Rico) which can help you find an energy consultant, as well help small and medium sized manufacturers with many other issues.

Energy service companies can design a performance contract to pay for changes through projected energy cost savings. The National Association of Energy Service Companies has a list of companies who have been accredited by this association. Thomas Net lists 855 suppliers of energy consulting services.

This image has an empty alt attribute; its file name is image-1.png

This work is licensed under a Creative Commons Attribution 4.0 International License.