Source: https://commons.wikimedia.org/wiki/File:Hot_Clinker_2.jpg
This photograph is in the public domain.
What’s new?
Thyssenkrupp is a large German construction company that specializes in designing and building production facilities for the chemical, cement, and mining industries. As described in this recent article on their website, thyssenkrupp engineers in Germany recently completed remotely the commissioning of a clinker production line in Guatemala; also thyssenkrupp engineers in India and Germany remotely performed a performance test on a plant in Kenya. Usually these tasks would be done on site, but COVID19 concerns led to remote completion instead.
What does it mean?
A contract to build a large production facility often includes, as one of the final steps, a demonstration that the facility works according to all the requirements in the contract; this step is called commissioning the plant. In addition, the contract may include a bonus payment if the facility can demonstrate its ability to meet a goal substantially beyond the minimum production rate specified in the contract; this step is called a performance test.
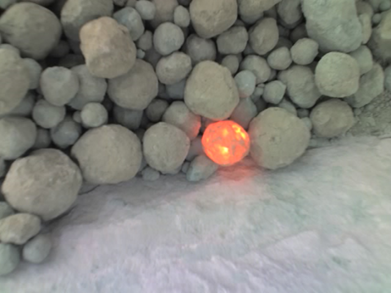
The production of Portland cement involves crushing rock of a certain composition, combining it with other material, heating the resulting mix to drive off undesirable gases, thus producing marble size material called clinker. Clinker is ground and mixed with other ingredients to form the final product, cement powder. Some plants may stop at the production of clinker, which can be shipped to locations near where cement is needed and ground into cement there. Shipping clinkers instead of the finished cement avoids “the difficulties of carrying cement powder.”
COVID19 has curtailed travel drastically and made many meetings move from face-to-face to online. People have had to adapt business practices in many ways. Some speculate that business travel may permanently decline, as methods are refined for better remote communication. What does it take to remotely commission or test the performance of such a complicated plant?
In full disclosure, I love Zoom. Being able to attend (and host) meetings with people from all over Pueblo (and further) without having to drive to town (and leave my wonderful home on 53 acres 10 miles down a dirt road) is fantastic. I meet twice a week online with my colleagues Elliott and Bill from EJB Partners; I can’t remember the last time we met in person (probably in March). But doing well at online meetings requires the right tools. As someone who wears hearing aids, clear sound at sufficient volume is important; I am still experimenting with speakers and microphones and I haven’t found the right headphones that work well for me. Many of us have learned to share screen and to use the chat box for public and private discussion to support the auditory channel during the meeting.
In this case, the thyssenkrupp engineers had to be able to observe and control the operation of the plant in some detail. In the first example, “A virtual control center was set up in Neubeckum, where thyssenkrupp’s commissioning engineers had the same picture in front of them as the customer’s operating personnel in Guatemala.” And similarly in the second case, “In virtual control rooms in Neubeckum, Germany, and Pune, India, the control panel of the plant in Kenya was projected onto huge screens.”
I have reproduced below a portion of the picture at the top of the thyssenkrupp news story.
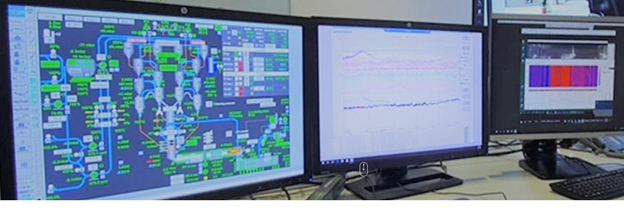
While not clear (and perhaps deliberately blurred by the company), the screen on the left can be seen to show a systems diagram for the plant, showing the flow of material and probably also displaying real time values of certain settings controlling the plant (for example, the status of valves) and real time values from certain sensors (for example, temperatures at different points). This systems diagram presents an overview and is probably be supported by more detailed views of portions of the overall system.
What does it mean for you?
A clinker production facility is a complicated device. The picture above represents the shared understanding of how the plant works, including how the material flows and how the parts interact with each other. This understanding reflects the knowledge of engineers and enables them to understand what is happening as well as share that understanding with each other. It is hard to overestimate the importance of this diagram in the ability of the thyssenkrupp engineers to communicate with those in the room with them as well as with those thousands of miles away. The icons, the colors, the lines, etc., all have specific meanings that all the engineers know immediately. Since the team involved in the performance test certainly included native speakers of at least German and Spanish, this diagram is written in a shared language that all understand.
What is the shared diagram for your organization? Creating such a diagram is hard work, even for a physical system such as a production facility; the creation of such a diagram is even harder for a system involving more than physical flows. At its simplest, the system diagram should show how objects (physical or conceptual) move through your organization, but you should also seek to understand and represent how your organization is placed within a larger system.
Creating that diagram will require making explicit knowledge that is already shared by the members of your organization, but it will probably also require unearthing implicit knowledge and reconciling the conflicting views of people in your organization. While chemical plants, circuit diagrams, and medical family trees, for example, already have standard icons and rules and you may be able to borrow some ideas from such sources, you will probably need to develop your shared language of symbols. You may find that no one in your organization understands some parts of your system, and you need to do some research or experiments to achieve that understanding. My first professional job (while I was in graduate school) was for the corporate planning officer at a major medical organization; I did many studies for him in order to support the organization’s understanding of its various systems. The goal is not just to support remote work, but to support more productive work in all forms.
Where can you learn more?
This free course on systems diagramming from the Open University is a great starting place for understanding the purpose of and techniques for systems diagrams. Tools that are useful for creating systems diagrams include process maps, mind maps, force field diagrams, and many more.
Companies offer tools to help you such, as the Business Model Canvas. The Object Management Groups has created a standard for Business Process Model and Notation.

This work is licensed under a Creative Commons Attribution 4.0 International License.